Bitcoin Investment Calculator: How Does Bitcoin Impact Your Traditional Portfolio?
Use the Bitcoin investment calculator below to find out how your traditional stock/bond portfolio would have performed (on a risk-adjusted basis) if you had invested in Bitcoin. For the traditional portfolio we use SPY and AGG ETFs as proxies.
Following piece was written on July 17th 2018.
Crypto investing is not for the faint of heart. In 2017 HODLers were taken on a rollercoaster ride, seeing BTC price start at around $1,000 in January 2017 surge rapidly towards the $20,000 level by December, and then fall sharply to $6,500 just two months later.
For those who got in late, the drawdown in BTC price was painful, and this sell-off has left many out there licking their wounds. On the flip side, those who got in just over a year ago when BTC was trading $2057 and HODLed were rewarded with a +227% return on their investment, with BTC trading $6,727 today.
In both cases, stomaching price swings has been no joke, and this ultimately leads us to ask: How much of my money should I allocate to Crypto?
There are already some similar research reports out there that walk potential investors through the scenarios of adding a % allocation of crypto to their portfolio, but here at CoinFi we decided to take it to the next level and built out a calculator for readers to experiment with.
In this research piece, we will go through in detail on how to use this nifty tool and also highlight some scenarios for discussion. (Written on July 17, 2018. SPY and AGG etfs are used for the 60/40 portfolio below.)
Starting With The 60/40 Portfolio
In traditional finance, an allocation of 60% to stocks and 40% to interest bearing securities such as bonds (60/40 portfolio) is the defacto standard.
A portfolio that holds both stocks and bonds has historically shown to provide better risk-adjusted returns than a pure stock portfolio, both from a Sharpe Ratio and a Max Drawdown perspective.
So before adding any allocation of crypto into our portfolio, this traditional portfolio gives us a “base case” to compare to. In our calculator, we use the following well-recognized ETFs:
- SPY SPDR S&P500 ETF as proxy for stock allocation - One of the most liquid ETFs that mimics the performance of the S&P 500; largely considered the equity index benchmark.
- AGG iShares Core U.S. Aggregate Bond ETF as proxy for bond allocation - ETF that tracks a broad market weighted portfolio of US denominated investment grade bonds.
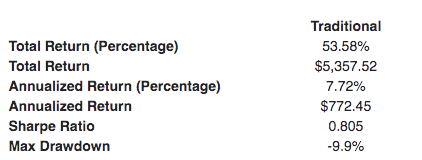
From Oct 2012 (the start date in our calculator i.e. when we get reliable Bitcoin price data), the traditional 60/40 portfolio on an initial investment of $10,000 had the following stats:
Adding 10% Bitcoin to the 60/40 Portfolio
So what happens when we add crypto into the equation? For our calculator, we use Bitcoin performance as proxy for the crypto market since:
- It has had a long enough history, while other cryptocurrencies don’t go as far back.
- Bitcoin is the most traded and original cryptocurrency.
In this scenario, we adjust our portfolio to include 10% Bitcoin. This means that the other 90% is split 60/40 between stock and bonds (54% and 36% respectively). Furthermore, we changed the starting date to Jan 2014. Prior to this date, Bitcoin was extremely niche and hence price then has less relevance in conducting back tests.
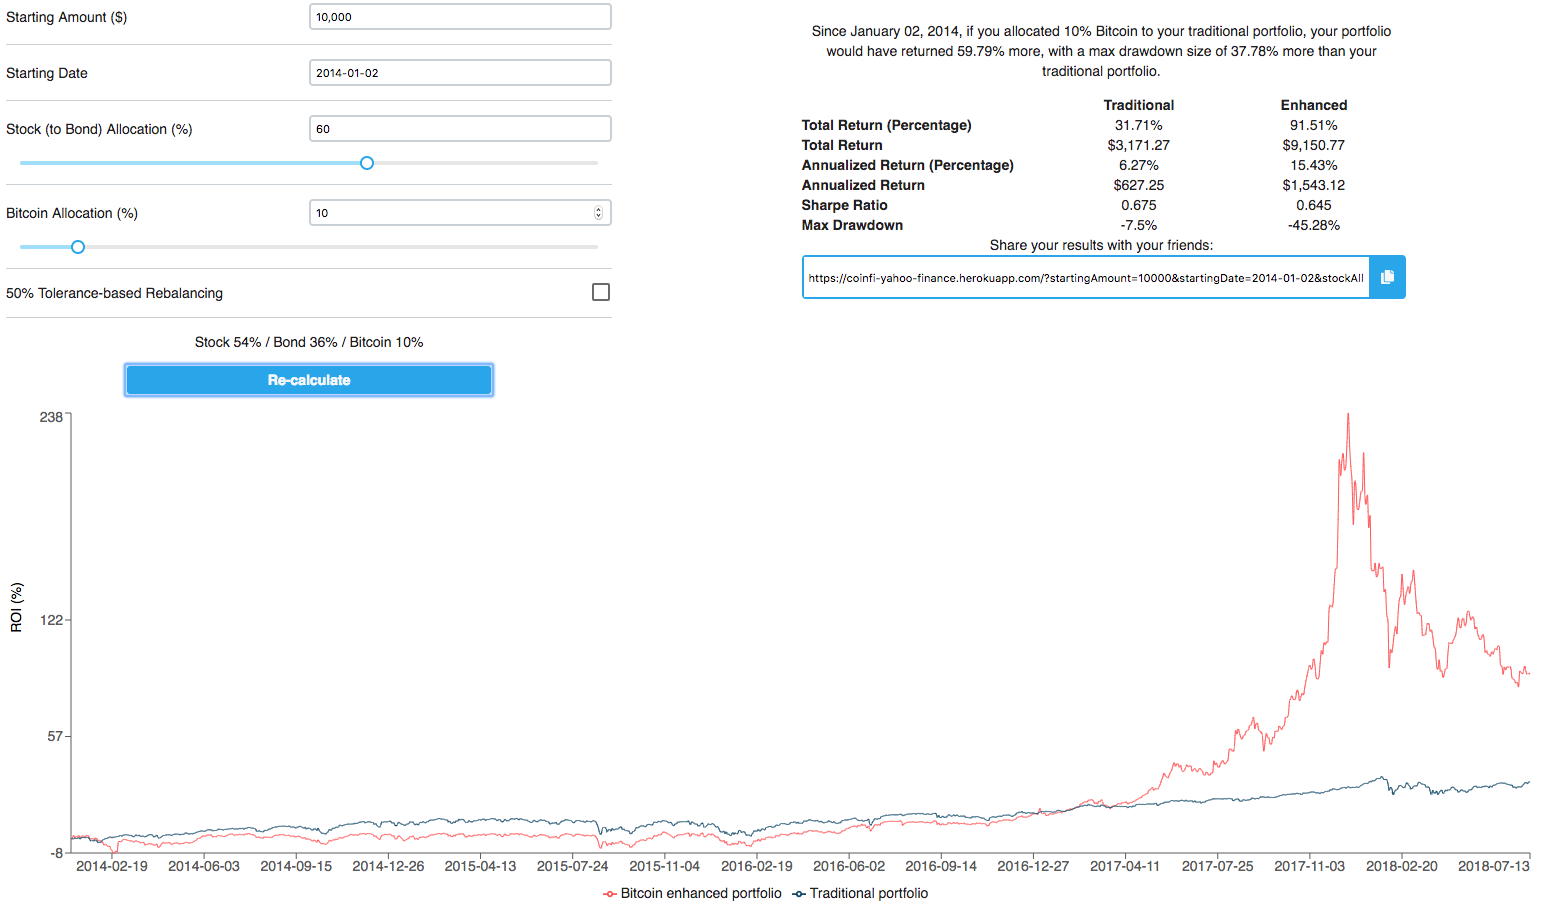
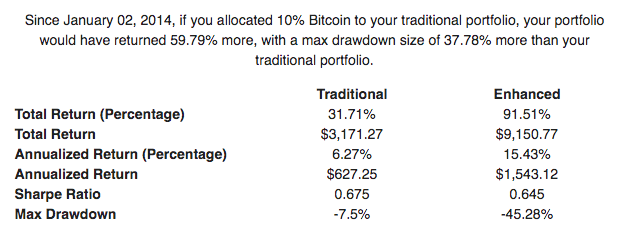
As you can see, adding 10% Bitcoin to the traditional 60/40 has drastically improved returns, but unfortunately at the cost of some nasty price swings:
- Annualized return improved to 15.43% from 6.27%
- Max drawdown is a lot worse at -45.28%! From the graph you can see it is due to the Bitcoin drop starting Dec 2017
- Sharpe ratio ended up staying roughly the same, so the risk adjusted returns did not improve
The case for Tolerance based rebalancing - What is it, and how does it work?
In our previous example, we took at 60/40 portfolio and allocated 10% to Bitcoin. However in this scenario if the price of Bitcoin changes drastically, the % allocation we have for Bitcoin will also fluctuate drastically.
Since 2014, the price of Bitcoin has skyrocketed, so the effect on our portfolio allocation would have been very significant. We illustrate with an example below:
- Let’s say we start with $100, we allocate 10% to Bitcoin and the rest to our 60/40 portfolio.
- This gives us $10 worth of Bitcoin, $54 in equities and $36 in bonds. A total portfolio value of $100.
- Let’s say Bitcoin price triples, while the price of our stocks and bonds remain unchanged. You now have $30 in Bitcoin and $90 in stocks and bonds. A total portfolio value of $120.
- So what was initially a 10% Bitcoin allocation grew to 25% of our portfolio ($30 out of $120), which leads to higher risk at a different point in time, and ultimately is not the diversification that was intended.
- For an asset like Bitcoin, the price jump was at one point more than 20-fold, and a portfolio that was only slightly exposed to crypto would eventually have crypto as its dominant position.
This is where ‘tolerance based rebalancing’ comes in. In our calculator there is a setting where you can toggle on/off ‘50% tolerance based rebalancing.
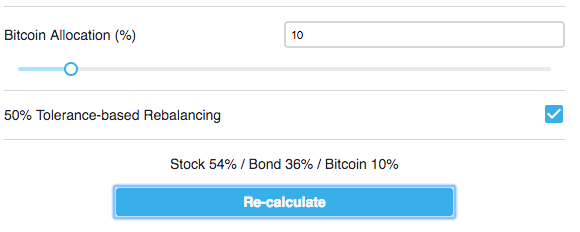
What this does for a portfolio that invests 10% in Bitcoin, is that everytime the allocation goes above 15% due to price increases, it will sell out the excess Bitcoin to bring it back to 10% and vice versa when the price drops and allocation falls below 5%.
Let’s see how implementing tolerance based rebalancing affects our 10% Bitcoin-enhanced portfolio:
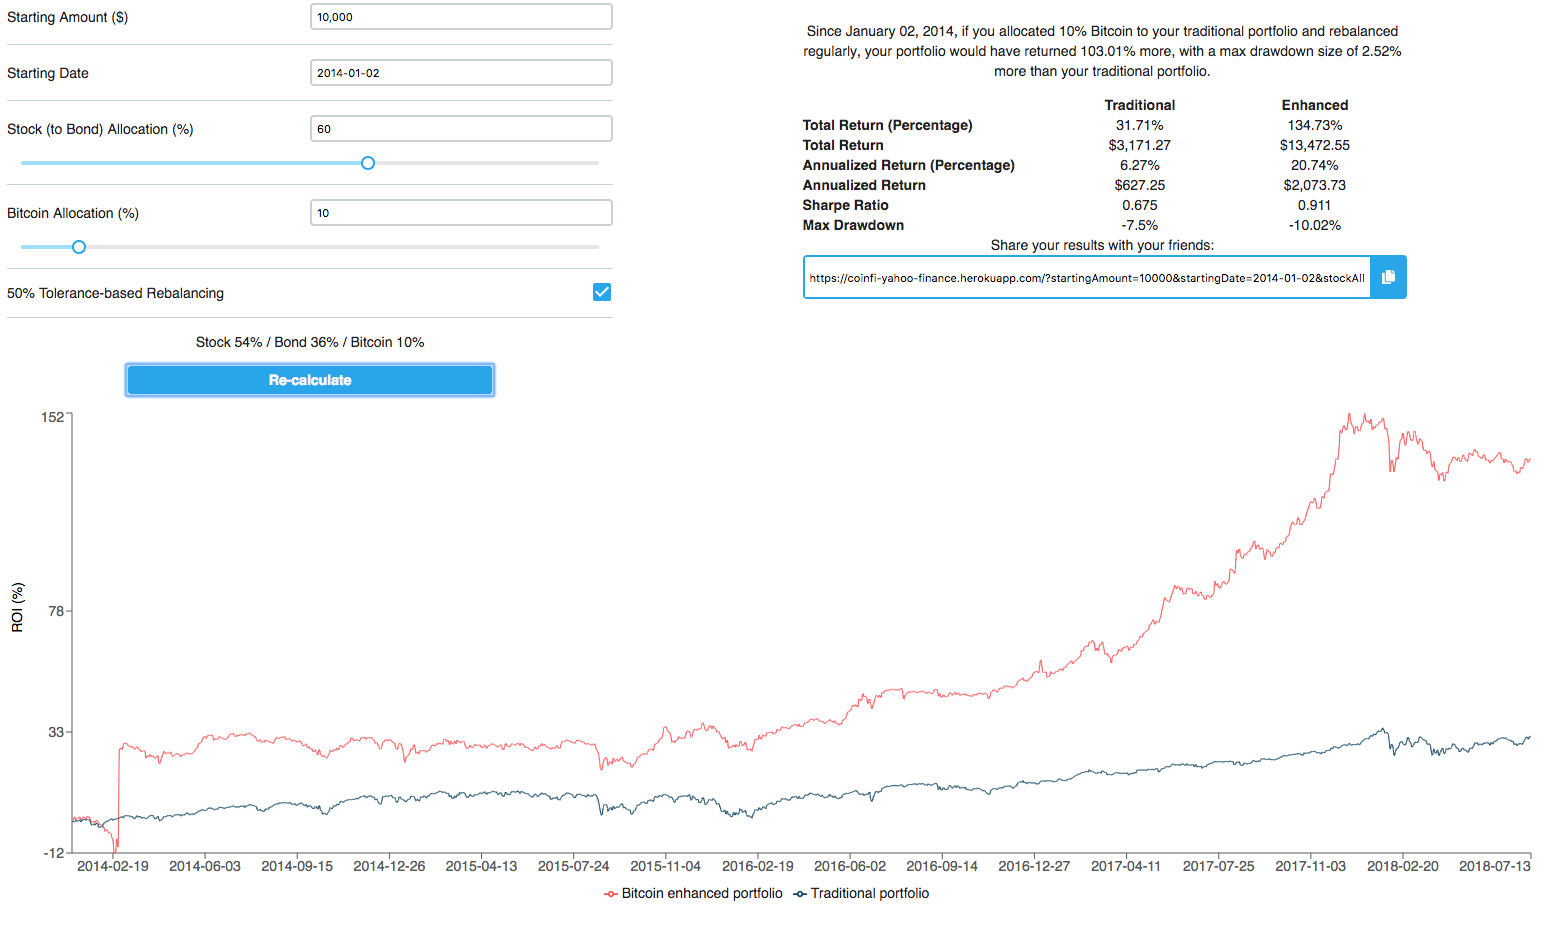
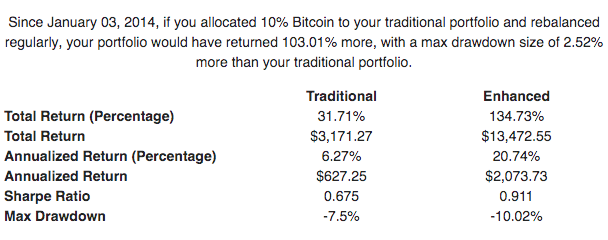
As we can see, using Tolerance Based Rebalancing has had a very positive effect, as evidenced by the improved Drawdown and Sharpe Ratio numbers.
- Max Drawdown which was previously -45% has improved substantially to -10.02%
- Sharpe ratio is now 0.911
Some of you may already know why this is the case - basically if the price of BTC rises above our threshold, we sell and if it falls below we buy. Basically, buying low and selling high, which is a money making formula!
There are however some caveats:
- Transaction costs are not included in our calculator. Most exchanges charge 0.1% per trade, if we had to rebalance 100 times the costs will add up.
- While in theory a volatile market that oscillates wildly benefits from rebalancing, imagine a different type of market where the price only goes up. In that case the rebalancing effect would mean selling out of the asset too quickly. This is evidenced by the lagging performance during Nov-Dec 2017 compared to the HODL only where the Bitcoin price only went up!
- Rebalancing is ultimately active trading. It means the investor needs to do work and be active in the market to rebalance their portfolio accordingly. So the portfolio is no longer a passive one.
Stats for 1/5/10% allocation table with rebalancing
Now let’s vary the Bitcoin allocation % and see the results:
| Bitcoin Allocation to 60/40 Portfolio | ||||
|---|---|---|---|---|
| 0% | 1% | 5% | 10% | |
| Total Return % | 31.71% | 37.23% | 69.57% | 134.73% |
| Annualized Return % | 6.27% | 7.24% | 12.37% | 20.74% |
| Sharpe Ratio | 0.675 | 0.832 | 1.098 | 0.911 |
| Max Drawdown | -7.50% | -6.79% | -6.83% | -10.22% |
As we can see adding any portion of Bitcoin to the 60/40 portfolio has generally yielded better results in many measures, and that around 5% allocation seems to yield the best risk adjusted returns.
A lot of this has to do with the fact that from 2014 till now, Bitcoin has gone from $800 to $6700 which trumps the return from holding index ETFs by a far margin.
So basically holding more Bitcoin is better regardless of volatility - hindsight is 20/20. This however doesn’t mean that we should necessarily expect the same returns going forward.
From Sep 2017 onwards:
To smooth out the effect from the huge surge in price in BTC, we can use the calculator starting from a different point in time when BTC was higher and the net change in price till now is not so large.
For this example we start at Sep 2017 when Bitcoin price was already at $4,700. From the previous table, it shows that a Bitcoin holding of roughly 5% with Tolerance Based Rebalancing looks to be most optimal on a risk-adjusted basis.
This is how the portfolio performs with a 5% allocation to Bitcoin from Sep 2017:
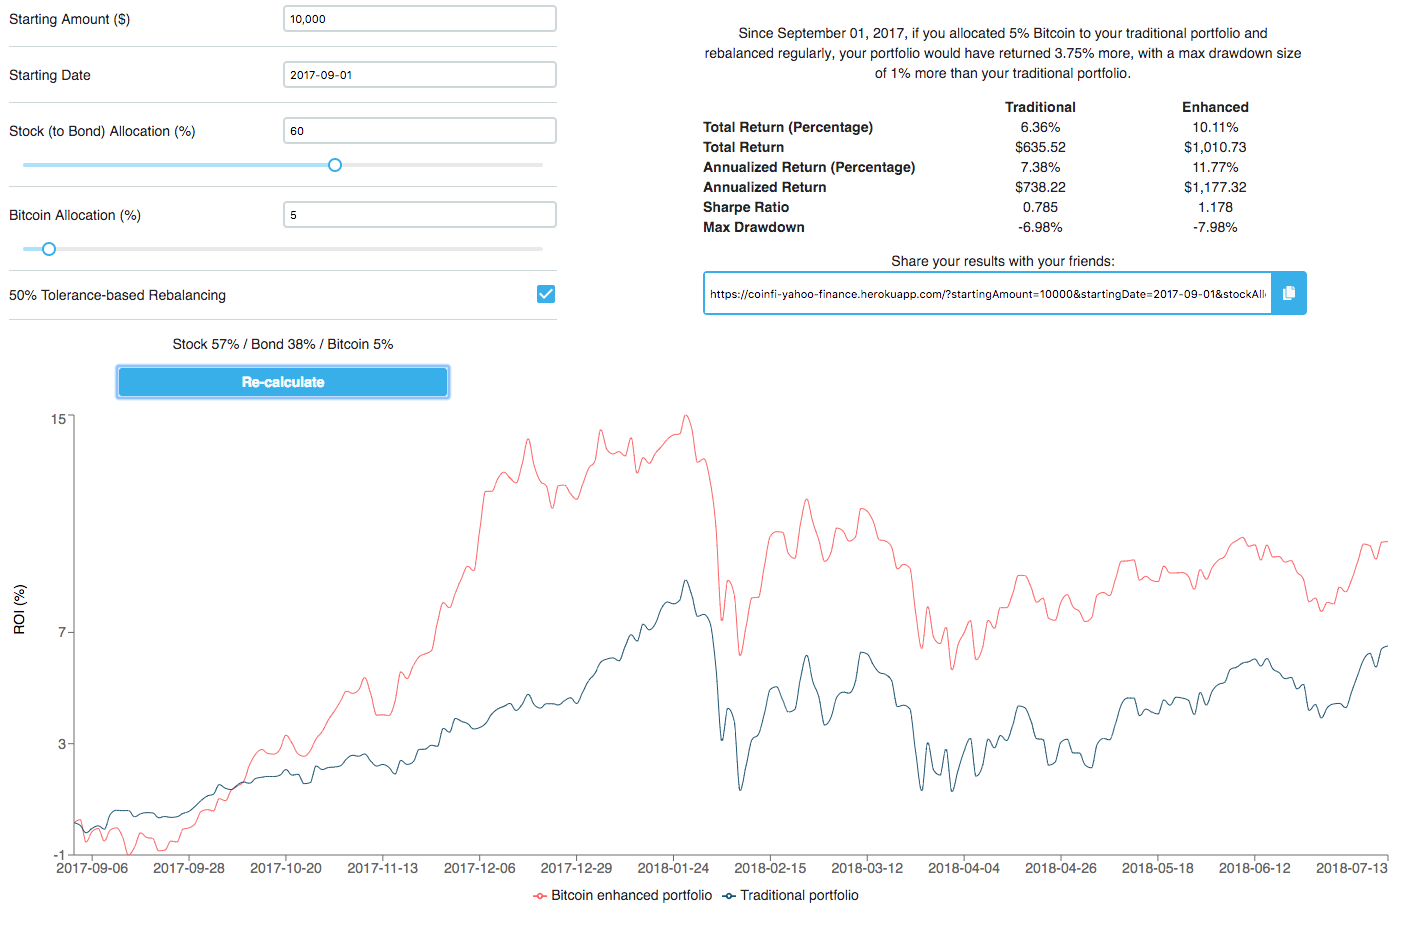
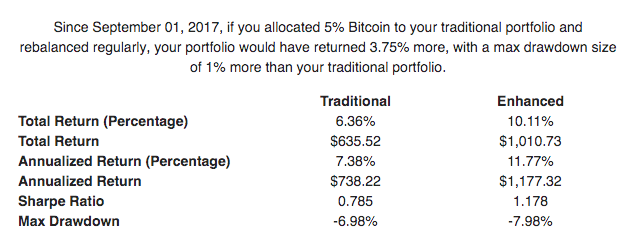
Even with a later start date at a higher Bitcoin price, including Bitcoin in our portfolio actually showed a significant improvement in our risk profile.
The Sharpe Ratio of our enhanced portfolio is above 1, and there is only a minimal trade off in Max Drawdown.
A large part of this has to do with the low correlation of Bitcoin to stocks and bonds (more on this another time), which ultimately means that having even a small portion of Bitcoin in a portfolio can be very advantageous. On the flip side, be wary of allocating too much - ultimately you have to be able to stomach the downside should anything catastrophic happen!
Deciding how much of your portfolio to invest in crypto is a tough choice, but interestingly allocating a small % of your portfolio to Bitcoin and rebalancing has historically increased returns with max drawdown that looks similar to your traditional portfolio.
With this tool, users can play around to see how adding crypto into your portfolio would have historically performed on a risk-adjusted basis, so please go ahead and give it a try. Also there is a link that saves your personal settings for you to share with your friends!
Definitions
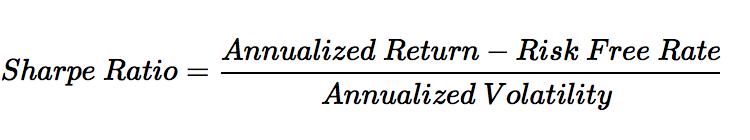
Sharpe Ratio: A measure of risk adjusted returns. More specifically it is the excess returns over the risk free rate per unit of volatility. Formula is as follows:
Max Drawdown: The maximum % loss from the peak to trough of a portfolio.